Posts

Platoon Splits, Then and Now: What the Data Shows

Image
Platooning in baseball — the practice of starting different‑handed batters depending on the pitcher’s handedness — has been part of the sport’s strategy for a long time. Even before the rise of advanced analytics, teams understood that hitters generally perform better against opposite‑handed pitchers. The ball is easier to pick up out of the pitcher’s hand, and breaking balls with horizontal movement tend to move in toward the hitter rather than away. Because of these long‑recognized advantages, managers have often adjusted their lineups instead of relying on a single everyday player. For the sake of using one simple stat, I’ll be looking at OPS (on base plus slugging) throughout this article. Platoon Splits Over Time First, let’s look at how platooning has changed over time. The red line in the graph shows percentages of plate appearances where the batter had the platoon advantage. Starting in the 1960s and through the 1980s, Platoon advantage increased from 50% to upwards of 60...

Surviving 27 Outs: No-Hitter Edition

Image
 Recently I wrote an out-by-out survival analysis of throwing a perfect game. Now, let’s discuss baseball’s next biggest achievement: the no-hitter. Like the perfect game, a no-hitter has a simple definition that adds to the prestige of it: pitch a complete game and win without giving up a hit. Because perfect games require no baserunners at all, both in and out of a pitcher’s control, they are much rarer than a no-hitter. Still, there haven’t been many. I used the same perfect game dataset from 1920-2025 of 379,815 starts. We are looking at the survival analysis of pitchers who started the game, so combined no-hitters are excluded. By MLB’s definition, a no-hitter has to be at least 27 outs and result in a win. That leaves us with 216 no-hitters since 1920. Like last time, my attention immediately points towards the fact that 0.057% of starts are no-hitters (216/379,815), but 0.058% are hitless through 27 outs. That’s because despite there being 216 no-hitters, there have be...

Surviving 27 Outs: A Data‑Driven Look at Perfect Games

Image
 I don’t think there’s a more celebrated feat in baseball than a perfect game. There are rarer feats, such as four home runs in one game (21 times) or 20 strikeouts in a 9-inning game (only five times), but I think what separates a perfect game is it’s less about matching a numeric record and more about accomplishing literal perfection. In a sport loaded with failure and random variation, a perfect game is not only pretty awesome by definition but also incredibly rare. There have only been 24 perfect games in history (including one in the playoffs by Don Larsen in 1956). Think about the 150+ years of baseball and hundreds of thousands of starts it took to accomplish those 24. To gain some appreciation, I wanted to calculate just how rare it is to accomplish a perfect game, out-by-out. How rare is it to even get half-way through a perfect game? How many outs do you have to be perfect through to have accomplished better than 99% of starts? Furthermore, of those starts that were per...

After Ted Williams: The 16 Players Who Hit .400 Across an 80‑Game Stretch

 Batting .400 is incredibly difficult. It hasn’t been done since 1941, when Ted Williams hit .406 (and famously did not win MVP). A lot of time has passed since, and the probability of seeing it happen again only seems more impossible with time. In 1941, MLB as a whole hit .261. In 2025, it was .245. I got curious and wanted to see, since 1941, who has even gotten close to hitting .400? For this exercise, I sampled all 80-game stretches (a nice round number for about a half-season of games) since 1941 to see any instance where a player hit over .400 during a season. Here are those 16 instances. Jackie Robinson – 5/8/1949-8/2/1949. Total hits: 124, total at-bats: 309, average: .401 Robinson got off to a slow start in 1949, hitting just .222 through his first 18 games before this hot streak. 1949 ended up being Robinson’s signature season, where he won NL MVP and led the league in stolen bases (37), bWAR (9.3), and batting average, where he ultimately ended at .342. Ted William...

Revisiting Guillen Number: Percentage of Runs Scored Via Home Run

Image
     Baseball Prospectus used to track a metric called Guillen Number, which was defined as “the percentage of a team’s runs which come via home runs.” It’s always been an interesting number to me, especially as a fan of the Yankees, a team that consistently is near the top in that percentage, and as a fan who has observed the shift in the game becoming more home run focused in general. I like this metric because it describes exactly what it describes: how often are teams scoring from home runs. It doesn’t describe how many runs that team scores or how good that offense is, but it gives implications that fans care about. Are teams with high Guillen scores reliant on home runs to score? Is it a bad thing to have a high Guillen number?      My main motivation for revisiting this metric is because it’s hard to find. I don’t believe Baseball Prospectus tracks it anymore, and easy access websites like Baseball Reference and Fangraphs would require a lot of cli...

How Do Tendencies Change on 3-0 Counts, and Should Batters Swing More Often?

Image
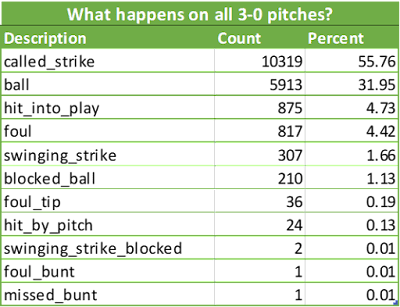
 Let’s look at the Statcast database again, this time examining 3-0 pitches. In the original article that I wrote introducing the database, I used the outcomes of 3-0 pitches as an example query. 3-0 pitches have always been a big deal in baseball. Batters commonly take a pitch on 3-0 (in fact 89% of the time). The thinking is that if a pitcher’s control is shaky enough to fall behind 3-0, he just might throw ball four, so the batter should make him prove that he can throw a strike. And if it ends up being a strike, you still have a hitter-friendly 3-1 count. I’ve noticed in recent years that it felt like batters were swinging on 3-0 more often. I remember Aaron Judge giving a quote (unfortunately I can’t find it) about how when he hits, he’s just looking to hit the best pitch of the at-bat, which is often on the 3-0 count. I will admit though that I’m surprised to see batters are still taking 3-0 pitches at a 89% rate. I would have guessed much lower, but for all I know this c...

Analyzing Strike Zone Data From the Statcast Database

Image
 With my Statcast database in Oracle nice and handy, let’s have some more fun and look at strike zone data. Strike zone data in Statcast is measured by two variables, plate_x and plate_z, which are like respective x and y coordinates of an axis. The strike zone is the width of home plate, which is 17 inches, although the rule book says specifically part of the baseball has to hit the strike zone for it to be a strike, so truthfully the strike zone is slightly wider than 17 inches. A baseball is three inches in diameter, so really the strike zone width is a number slightly smaller than 23 inches. Statcast measures plate_x and plate_z in feet, not inches. The middle of the strike zone width is a plate_x of 0 (like an axis origin of (0,0)), with pitches to the left being a negative value of plate_x and pitches to the right being a positive value of plate_x. For example, the strike zone is 17 inches wide (1.417 feet), so the left edge has a value of -0.7083 and the right edge has a ...